Most people who follow the stock market check the Sensex and Nifty every day without fully understanding what those numbers represent or what they are actually telling you. They know that when the Sensex goes up, the market is doing well, and when it drops sharply, something has gone wrong. But the deeper question of how these indices are constructed, why they move the way they do, and how they should actually influence investment decisions is something that rarely gets explained clearly.
This article covers what Sensex and Nifty are, how each stock market index is built and maintained, how the two differ, and most importantly, how to actually use index movements to make better investment decisions rather than reacting emotionally to daily fluctuations.
What Is a Stock Market Index?
A stock market index is a statistical measure that tracks the performance of a selected group of stocks. Rather than showing you what every listed company is doing, an index takes a representative sample of stocks, applies a methodology to weight them, and produces a single number that reflects the collective movement of that group.
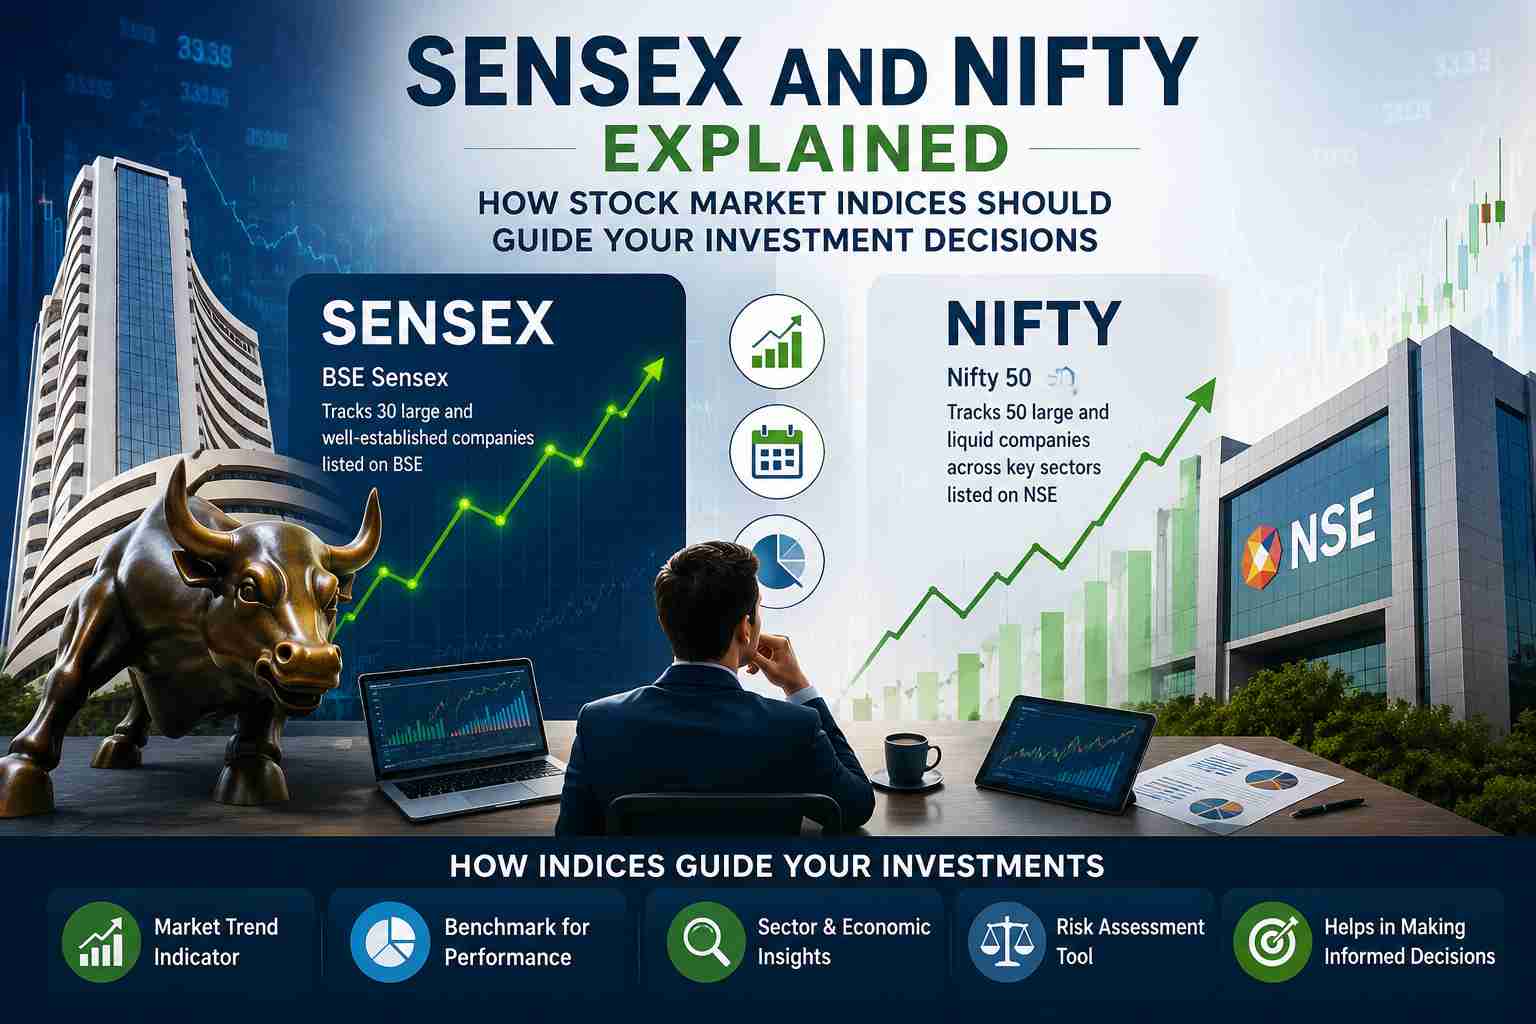
Understanding the Sensex
The Sensex, short for Sensitive Index, is the benchmark index of the Bombay Stock Exchange. It was launched in 1986, making it one of the oldest equity indices in India. The Sensex tracks 30 of the largest and most actively traded companies listed on the BSE, selected across a range of sectors to represent the breadth of the Indian economy.
How the Sensex Is Calculated
The Sensex uses a free-float market capitalisation methodology. This means that instead of taking the total market capitalisation of each company (share price multiplied by all shares outstanding), it only counts the shares that are freely available for trading in the public market. Shares held by promoters, governments, or strategic investors that are unlikely to trade regularly are excluded from the calculation.
Why Nifty Uses 50 Stocks Instead of 30
The broader composition of the Nifty means it covers more sectors and companies, making it slightly more representative of the overall market than the Sensex. A portfolio of 50 stocks is less vulnerable to the idiosyncratic performance of any single company or sector.
Key Differences Between Sensex and Nifty
While both indices track large-cap Indian equities using free-float market cap methodology, there are meaningful differences worth knowing:
- Sensex covers 30 stocks listed on BSE; Nifty covers 50 stocks listed on NSE
- Sensex was launched in 1986 and has a longer history; Nifty was launched in 1996
- Both use the same core methodology, but the broader Nifty composition means slightly lower concentration risk
How to Actually Use Index Movements in Your Investment Decisions
This is where most investors go wrong. They watch the index move up or down each day and make impulsive decisions based on short-term fluctuations that carry very little signal about long-term value. Understanding how to interpret index movements takes practice, but a few principles help.
Distinguish Between Noise and Signal
Daily index movements, especially moves of less than one percent in either direction, are largely noise. Markets adjust constantly to new information, changing sentiment, global cues, and flows from institutional investors. None of this tells you much about whether Indian businesses are becoming more or less valuable over the long term.
Market Corrections and How to Respond
A correction is typically defined as a decline of 10 percent or more from a recent peak. A bear market is a decline of 20 percent or more. Both are normal features of equity markets and have occurred multiple times throughout the history of both the Sensex and the Nifty. Looking at the long-term chart of either index, every correction that seemed devastating at the time was eventually followed by a recovery and new highs.
This historical pattern does not guarantee the future will follow the same path, but it does provide context for how to think about drawdowns. For a long-term investor, a market correction is typically a more attractive entry point than a market peak, even though it feels far more uncomfortable to invest during one.
In Conclusion, Sensex and Nifty are not just numbers on a ticker. They are carefully constructed measures of how India’s largest listed companies are performing, built on a methodology that reflects free-float market capitalisation and reviewed periodically to stay relevant. Understanding what they measure, how they differ, and what their movements actually mean allows you to use them as genuine tools rather than sources of anxiety.